Country-scale detection from 56 annotations

Picterra enables users to train custom detectors - deep learning models - and apply them at scale on drone, aerial or satellite imagery. Without writing a single line of code.

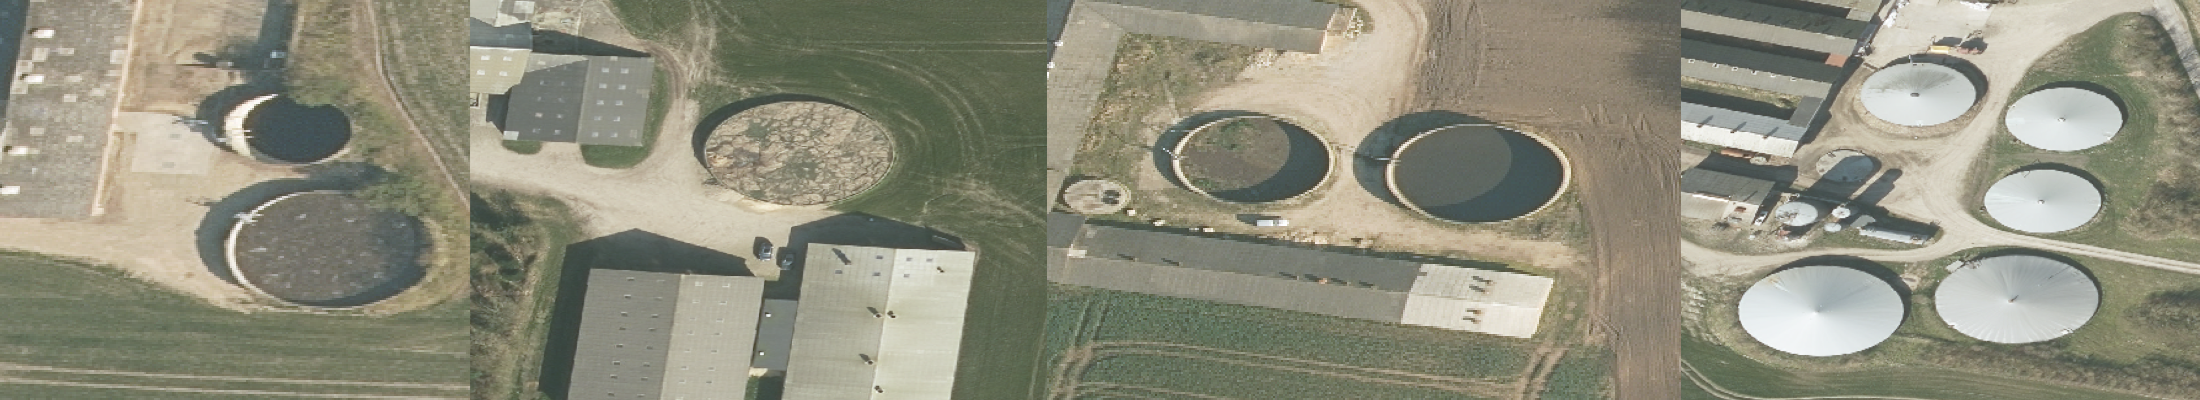
This is an example of how SEGES - one of Picterra's customers - was able to detect 26.000 slurry tanks over Denmark in a few hours with only 56 training annotations. The end goal is to estimate the ammonia emissions.

Scroll to continue

SEGES is a part of the agricultural advisory service and owned by the Danish farmers.

In order to calculate the total Danish emission of ammonia the Ministry of Environment needed data on the total number of slurry tanks and information on the coverage of the tanks, as the emission factors are lower for covered tanks than from uncovered tanks.

The area highlighted in white is Denmark

Scroll to continue

To conduct their analysis, SEGES had to detect slurry tanks.

Slurry tanks are round-shaped objects. There is quite some variety in their appearance though because they can be filled or empty and they can have a roof or not. They also look similar to silos that are also found near farms.

The map shows a few example of slurry tanks

Scroll to continue

Slurry tanks are built next to farms. So circles around each farm in Denmark were used as detection areas.

Detection areas focus the detector on specific part of the image to save processing resources and speed up the detection process.

Detection areas are displayed as purple circles on the map

Scroll to continue

There are 34,000 such detection areas, spread over the whole country.

Each purple dot is a detection area

Scroll to continue

A total of 26000 slurry tanks were detected.

SEGES combined the detections with internal data about the type of production for each farm to produce area statistics for the various categories. These statistics were then used to produce an estimate of slurry tanks ammonia emissions.

Scroll to continue

The detections can be visualized in various ways. For example, this is a heatmap visualization.

Liked this story ? Give Picterra a try and share it !